3. Net & Big Data
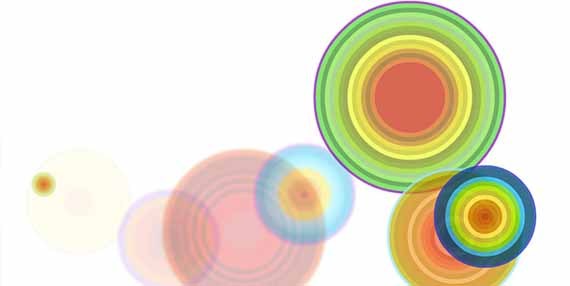
A Mathematical Theory of Communication, Casey Reas, 2014.
Art made of data
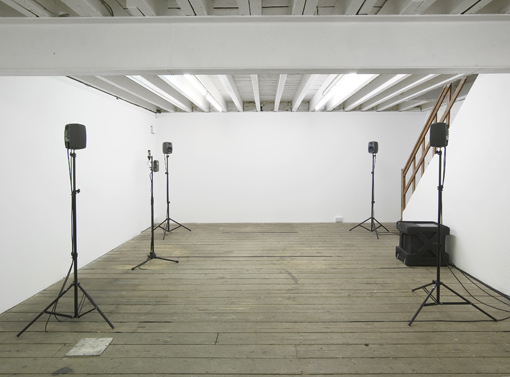
Example: Flow, maotik (Mathieu Le Sourd), 2016
Artistic intention:"Through this installation I wanted to communicate this excitement of living something that is happening here and now. "
"I grew up by the Atlantic Ocean and I have always been under the charm of the horizon scenery and especially the fact that it changes visually according to parameters such as sea levels, wind or weather cast. You can go the coast every day and you will always see something different. I thought that was really something interesting to explore using generative system. My idea was to represent these morphing landscapes into an immersive multimedia experience."
"Ocean can be a relaxing and a playful place but at the same time it can be dangerous and can also be really imposing to human, warning us how small we are compared to nature and why we have to respect it."
"This project was an opportunity to expand my field of research on adding real time data to transform nature data into a poetic interpretation. Mirroring the relationship between nature and art to reconsiders the implications of human presence in the natural world."
1. Data Source: "I used 11 parameters to define the ocean form, we connect ourselves to a database and retrieve data such as sea levels, tide coefficient, humidity, weather cast, wind force, wind direction, weather cast, moon cycle, location, time of the day. When parameters such as wind force or sea levels will affect the movement of the sea others such as weather cast or humidity will change the colors."
2. Algorithms: "The difficult part was create algorithms that would always keep an interesting aesthetic in terms of visual and sound."
"The idea is to give enough intelligence and randomness to the system so the visuals becomes organic and unpredictable."
3. Parameter Mapping: "When parameters such as wind force or sea levels will affect the movement of the sea others such as weather cast or humidity will change the colors."
4. Audiovisual stimuli:The visual projection resembles the waves.
Source: Flow: A Sea of Real-time Data
General process
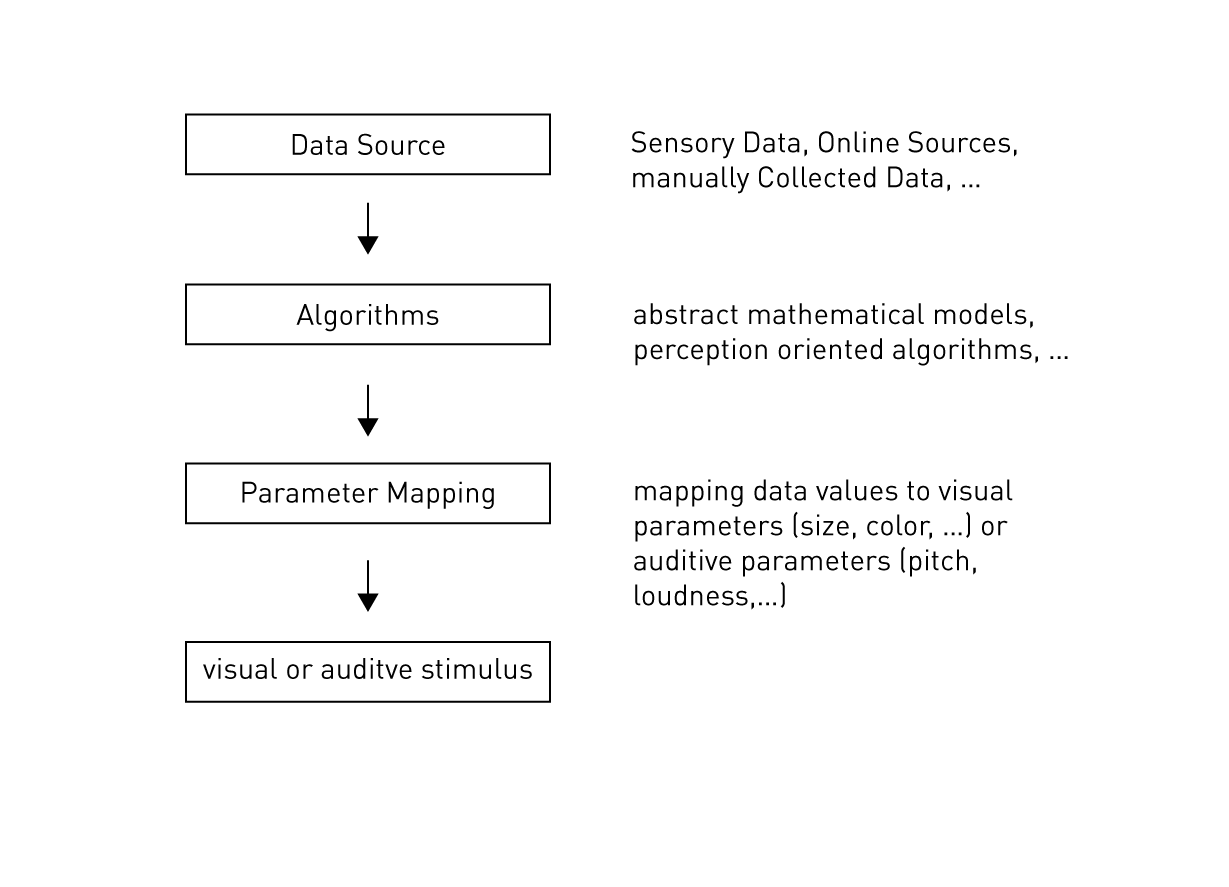
1. Data sources
Self-tracking – Link
Data from social media
Real-time
Scientific Data – Biology, Astrophysics, …
Recorded
Databases
Net – Example Codeology
Bloom, 2013, by Ken Goldberg, Sanjay Krishnan, Fernanda Viégas, and Martin Wattenberg
24 Hours European Flight Air Traffic Visualization
Six drawings, Mathieu Le Sourd, 2014.
SIX DRAWINGS is a short instrumental audiovisual performance where a percussionist uses an amplified balloon as an audiovisual instrument. With a contact microphone and a MIDI pedal for effect, the performer explores different techniques to generate sounds (grinding, strokes, bubbles or breathing) and visuals in order to create a unique audiovisual composition. Sound reactive generative visuals (gives the illusion the public to be inside the instrument, inside the baloon.
2. Algorithms
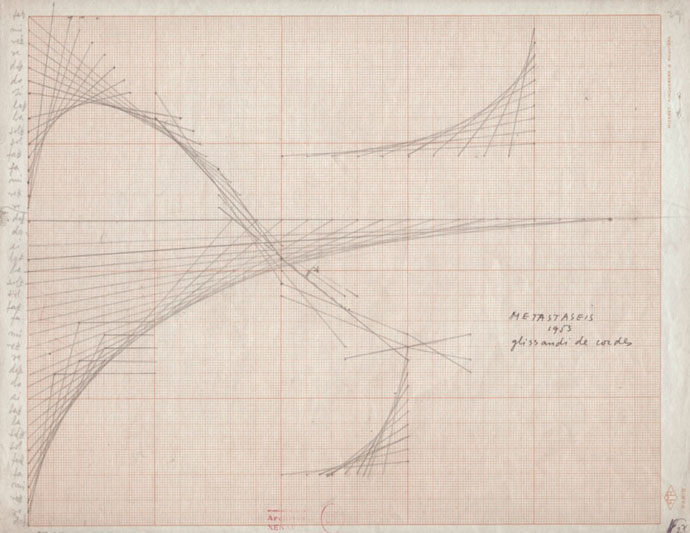
Metastaseis (Iannis Xenakis, 1954)
N'Shima (Iannis Xenakis, 1975)
3. Parameter Mapping
Bestimmte Werte von Datensätzen auf visuelle oder klangliche Parameter zu übertragen wird als Parameter-Mapping bezeichnet. Es handelt sich dabei um eine Art Übersetzung von Daten in sichtbare oder hörbare Eigenschaften von Objekten.Bei einem einfachen Diagramm werden wie in obigem Bitcoin-Beispiel zwei Werte verwendet, um die Position eines Punktes auf der x- und y-Achse zu definieren. Es sind aber natürlich alle anderen von Zuweisungen möglich, komplexere, spannendere. Ein Wesentlicher Anteil an Generativer Kunst oder Generativer Gestaltung ist, clevere Ideen für die Übersetzung, das Mapping, zu haben.
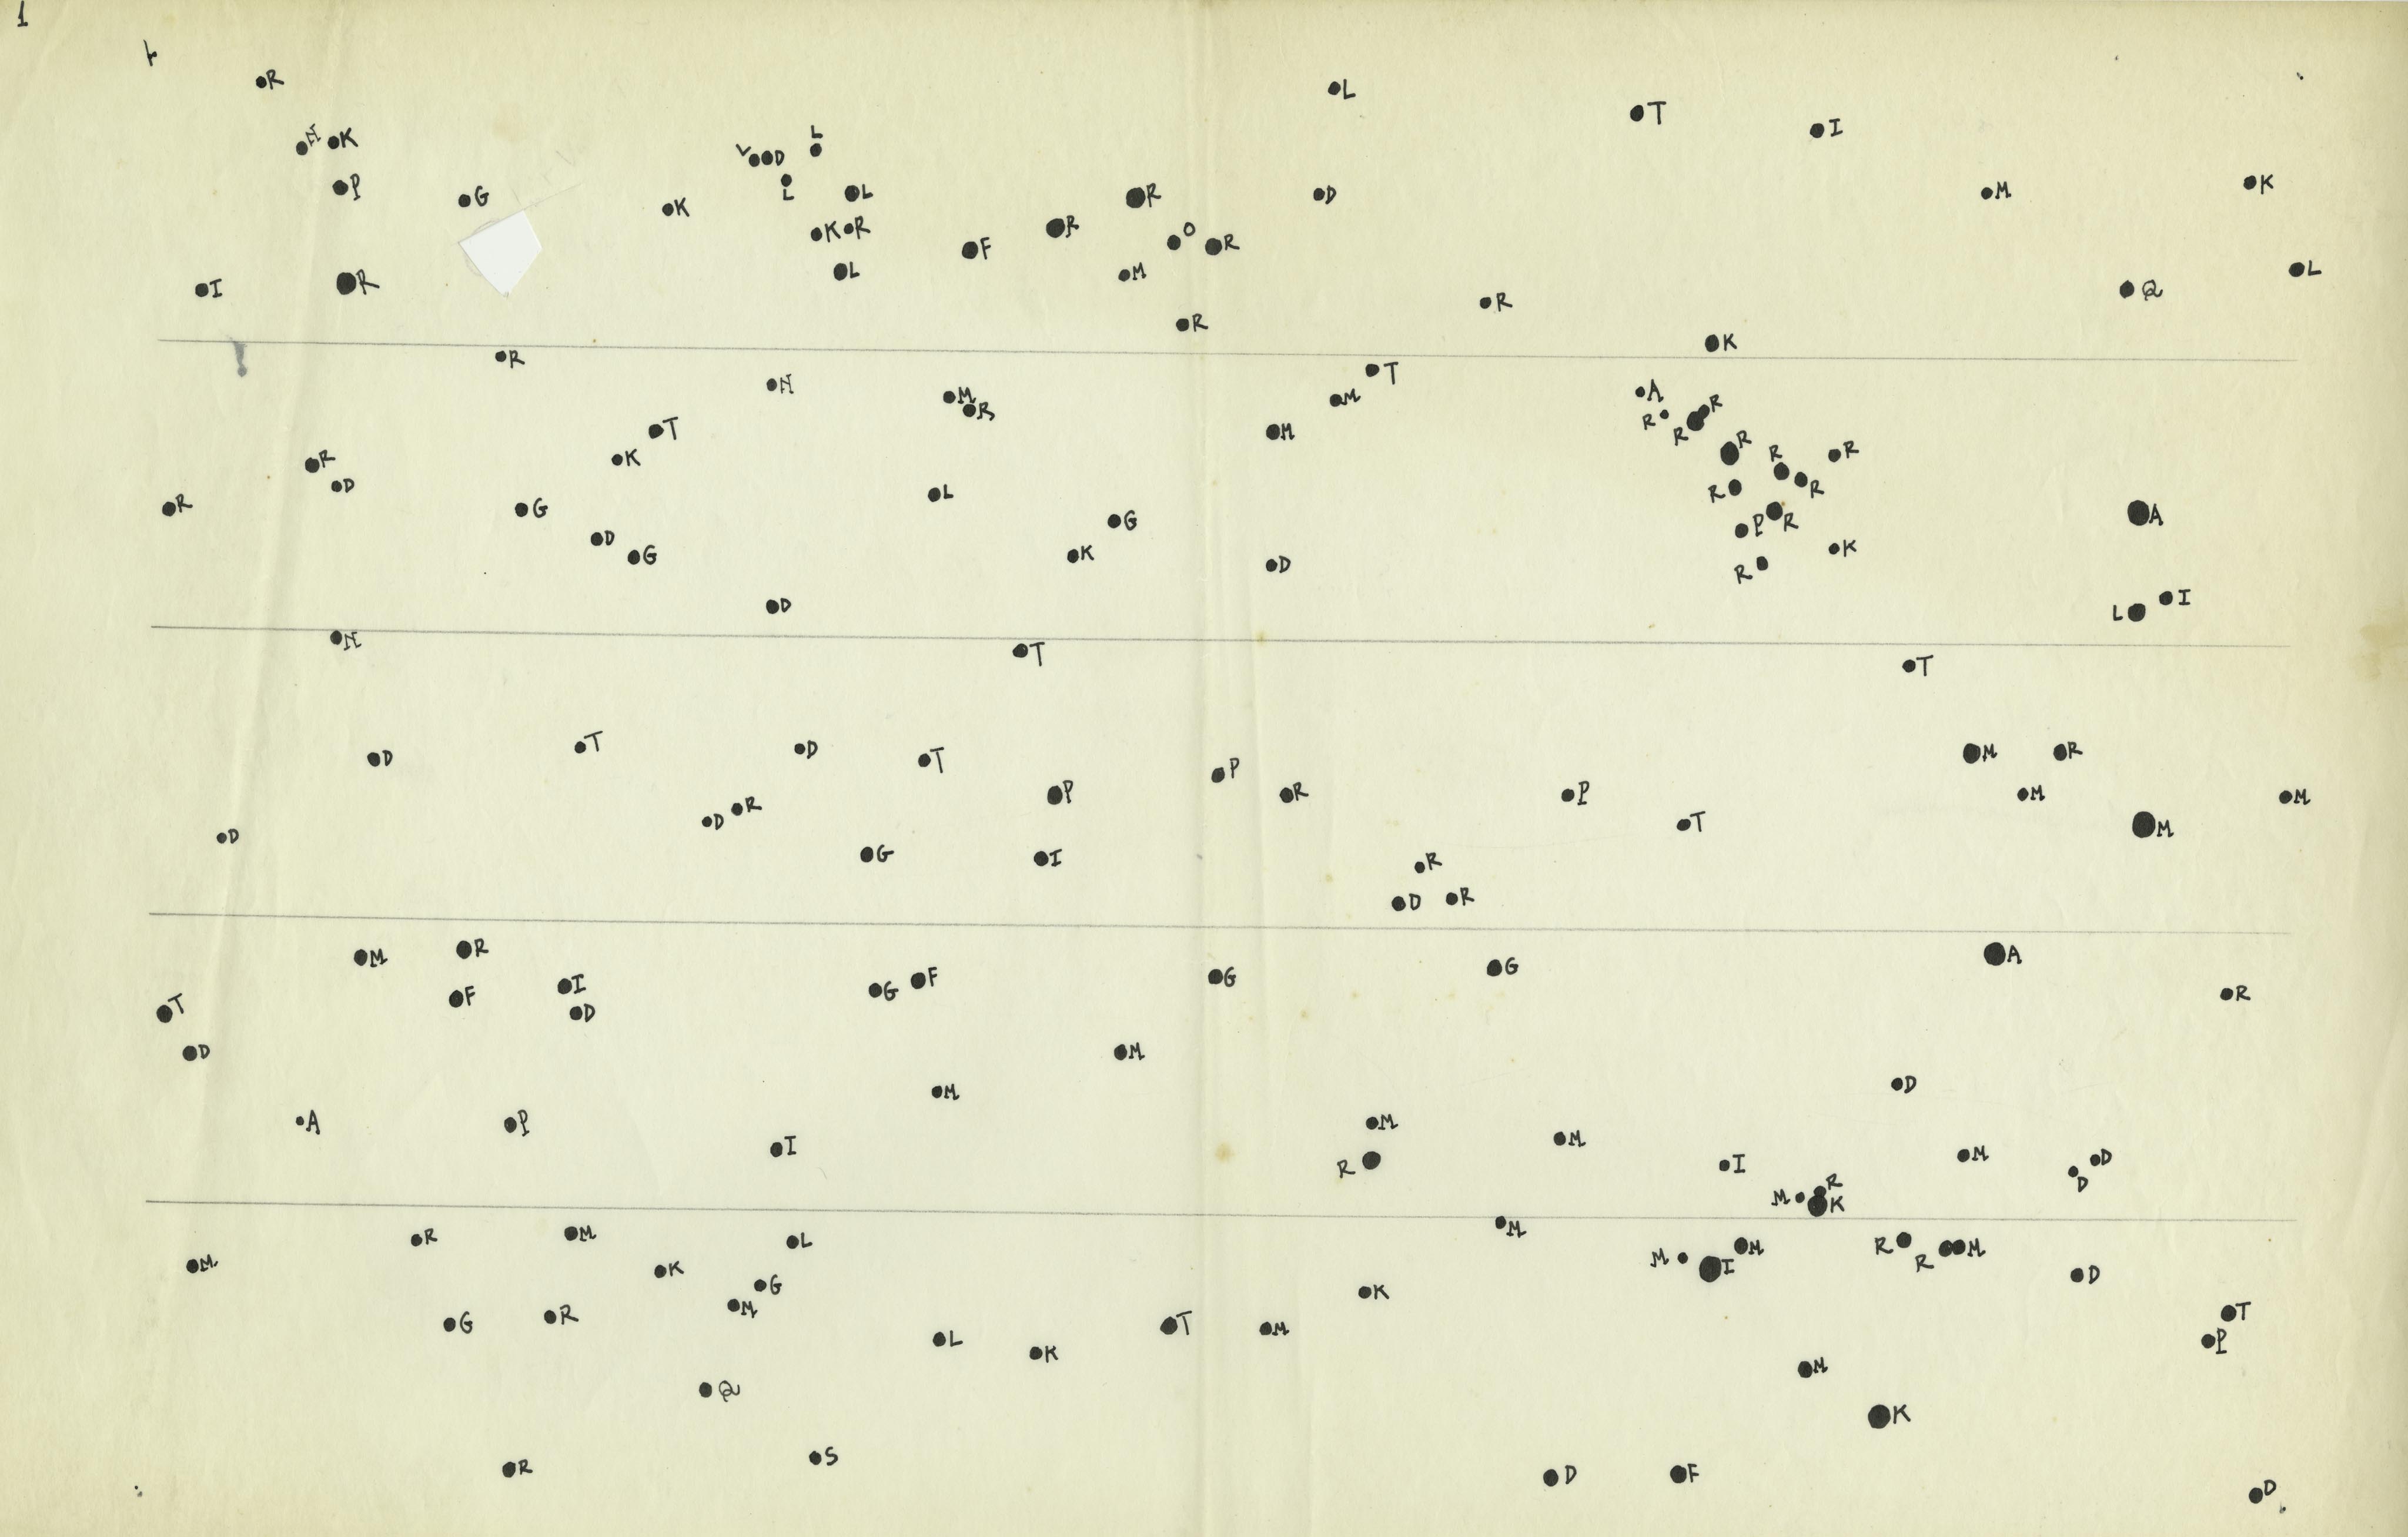
Atlas Eclipticalis, John Cage, Composed between 1961 and 1962
Manuscript: Link
Performance: here
Beispiel: Particle Noise, Carsten Nicolai (2013)
"The sound installation particle noise documents the radiation flow rate of the respective place it is installed by transferring it on an audio level. Two Geiger counters – one analogue, one digital – measure the level of radiation (α, β, γ) inside the exhibition space. Signals from each device trigger sounds of either a sine wave generator or a radio receiver and distribute them in the space via a four-channel sound system. Depending on the intervals of radiation recognition the frequency of the sine waves and the panning of the static noise change their bias hence constantly change the atmosphere of sound in the room. The work is yet another example of a work shifting otherwise unnoticable phenomena on a perceivable level allowing invisible radiation signals that occur in nature to become an audible soundtrack of our surrounding terrestrial and extraterrestrial environment."
4. resulting visual and auditve stimulus
perceivable vs. non-perceivable
art vs. information-design
Information Design
INEQUALIGRAM (Lev Manovich et al, 2016)
"What do millions of social media images shared in New York, Bangkok, Sao Paolo, or London tell us about each city? Which parts of a city receive most attention and which remain invisible? How can we quantify and measure these patterns?
Inequaligram project analyzes 7,442,454 public Instagram images shared in Manhattan over five months. We use measures of inequality from economics to analyze differences in sharing between parts of a city."
Scientific

Selfiecity (Lev Manovich et al, 2014)
"Selfiecity investigates selfies using a mix of theoretic, artistic and quantitative methods:
We present our findings about the demographics of people taking selfies, their poses and expressions.
Rich media visualizations (imageplots) assemble thousands of photos to reveal interesting patterns.
The interactive selfiexploratory allows you to navigate the whole set of 3200 photos.
Finally, theoretical essays discuss selfies in the history of photography, the functions of images in social media, and methods and dataset."
Art
Nathalie Miebach: Art made of storms
Architecture of Radio, 2016
Access internet data sources
Retrieving JSON-Data from Web-Servers
JSON (JavaScript Object Notation) is a popular standard to exchange data between applications. Originally is based on Object Notation of JavaScript but is used in many other languages as well.
Introductions to JSON can be found among others for example here:
http://www.w3schools.com/js/js_json_intro.asp
https://de.wikipedia.org/wiki/JavaScript_Object_Notation
JSON-Data is structured as objects:
{
  "Herausgeber": "Xema",
  "Nummer": "1234-5678-9012-3456",
  "Deckung": 2e+6,
  "Waehrung": "EURO",
  "Inhaber":
  {
    "Name": "Mustermann",
    "Vorname": "Max",
    "maennlich": true,
    "Hobbys": [ "Reiten", "Golfen", "Lesen" ],
    "Alter": 42,
    "Kinder": [],
    "Partner": null
  }
}
Example: Bitcoin Data
All available data on Bitcoin is obtainable from the site blockchain.info. The pages containing the charts also provide the corresponding JSON-Data:
{
  "status": "ok",
  "name": "Market Price (USD)",
  "unit": "USD",
  "period": "day",
  "description": "Average USD market price across major bitcoin exchanges.",
  "values": [
    {
      "x": 1457222400,
      "y": 408.86
    },
    {
      "x": 1457308800,
      "y": 411.94
    },
    {
      "x": 1457395200,
      "y": 412.39
    },
    {
      "x": 1457481600,
      "y": 413.1
    },
    {
      "x": 1457568000,
      "y": 416.0
    },
    {
      "x": 1457654400,
      "y": 421.22
    },
    …
Processing stellt das Objekt JSONObject zur Verfügung, um JSON-Daten mit mehreren Paaren aus Namen und zugehörigen Werten zu verwalten. Die Werte können etwa Zahlen oder Strings sein. Einerseits können durch JSSONObject JSON-Daten geladen werden oder aber andererseits auch Daten in Processing in JSON-Objekte abgelegt und abgespeichert werden.
JSONObject BCPrice;
JSONArray BCPriceValues;
JSONArray BCPriceValues = BCPrice.getJSONArray("values");
Mit der Funktion loadJSONObject() lassen sich JSON-Daten aus einem lokalen Ordner oder von einem Server laden:
BCPrice = loadJSONObject("https://api.blockchain.info/charts/market-price?format=json");
Durch das '&'-Zeichen werden der URL Parameter angehängt. Welche Parameter möglich sind hängt vom Datenservice und der API ab. Bei Bitcoin sind es bspw. die Parameter für den Zeitraum der Abfrage, für das Format (hier json) oder die Sprache.
Das Objekt JSONArray speichert einen Array von JSON-Objekten. Die Funktion getJSONArraygibt einen Array mit den JSON-Objekten eines bestimmten Namens zurück:
JSONArray BCPriceValues = BCPrice.getJSONArray("values");
Example: Visualizing the flight of the ISS
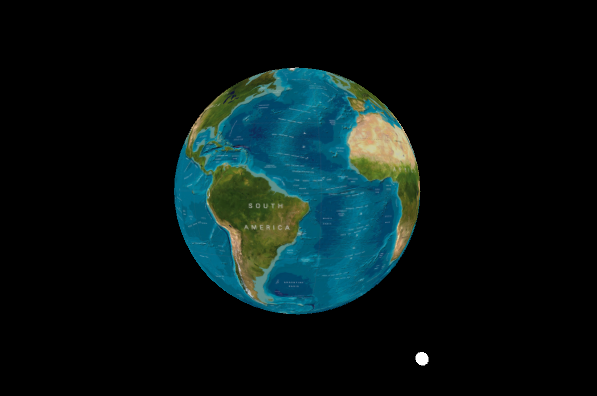
// Just a proof of concept.
// Could be optimized by implementing earth`s inclination and adjusting texture to (0,0).


JSONObject ISSdata;
JSONObject ISSloc;

PImage earth;
PShape globe, ISS;
float rot = 0;
float radius = 200;
float latitude, longitude;

void setup() {
  size(600, 600, P3D);
  background(0);

  // 1. Data -------------------------------------------------------------
  ISSdata = loadJSONObject("http://api.open-notify.org/iss-now.json");
  ISSloc = ISSdata.getJSONObject("iss_position");
  latitude = ISSloc.getFloat("latitude");
  longitude = ISSloc.getFloat("longitude");
  // ---------------------------------------------------------------------
  lights();
  earth = loadImage("data/worldmap.jpg");
  noStroke();
  globe = createShape(SPHERE, 120);
  globe.setTexture(earth);
  ISS = createShape(SPHERE, 5);
}

void draw() {

  // 2. Algorithm --------------------------------------------------------
  float radLat = map(latitude, -90, 90, 0, PI);              // Geolocation Latitude ranges from -90 to 90 and is mapped
                                                            // to spherical coordinates (0, PI)
  float radLong = map(longitude, -180, 180, -PI, PI);
  //float radLat = radians(latitude);
  //float radLong = radians(longitude);
  float x = radius * sin(radLat) * cos(radLong);
  float y = radius * sin(radLat) * sin(radLong);
  float z = radius * cos(radLat);
  // ---------------------------------------------------------------------


  // 3. Mapping + 4. Sensoric output -------------------------------------
  background(0);
  translate(width/2, height/2);
  rotateY(rot);
  shape(globe);
  translate(x,y,z);
  shape(ISS);
  // ---------------------------------------------------------------------

  rot+= 0.002;
}
Short Exercise 1 (30 Minutes):
Go to the website https://www.data.gv.at and find out, from wich URL data can be retrieved. Display the feed in Firefox and analyze it. Can you also load it with Processing and print the data to the console (command: "println()")?
More examples of available online data sources
- www.data.gv.at – offene Daten Österreichs
- www.opendataportal.at – Open Data Portal Österreich/
- govData – Datenportal für Deutschland
- Tracking the current position of the International Space Station
- Link-List: http://www.scribblelive.com/blog/2012/03/30/data-sources/
- Example: WHO, Adult mortality
A more complex approach in processing simple ISS location
Data:
1. ISS location Location
2. Number of People in Space Online
3. Date available from Processing
4. Weather Historical Wather Data: OpenWeatherMap
Mapping:
1. Distance from equator -> visual: Length of curves, auditive: loudness
2. Month of year -> visual: color of Stroke (cold colors for winter, warm colors for summer), auditive: brightness of sound
3. Number of People in Space -> visual: Number of Clusters, auditive: number of tones
4. How bright is the day (0-100% clouds) -> visual: blur, "fog", auditive:
5. How windy is the day -> visual: speed, auditive:
Algorithm:
1. calculate sphere with radius = longitude
2. generate random points (n= persons in space) on the sphere
3. set hues for lines based on month of the year
4. draw bezier curves between points (connectivity = clouds; radius of roundness = wind)
5. draw fog (density = clouds)
Sensoric Output:
Colorful Bezier Curves floating through space. Droning Sound, darker
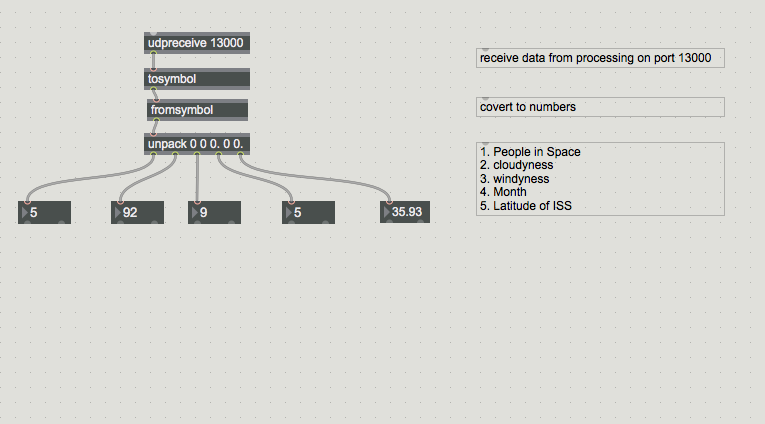
import netP5.*;
import oscP5.*;

OscP5 osc;
NetAddress myRemoteLocation;

JSONObject ISSdata;
JSONObject WEATHERdata;
JSONObject PEOPLEdata, weatherClouds, weatherWind;
JSONArray people;
int peopleAmount, cloudAmount;
float windAmount;

PVector points[];
PVector center = new PVector(0,0,0);
Connection connections[];


int d = day();    // Values from 1 - 31
int month = month();  // Values from 1 - 12
int y = year();   // 2003, 2004, 2005, etc.
float monthHue;

JSONObject ISSloc;


float thickness = 40;


PShape globe, ISS;
float rot = 0;
float radius = 200;
float latitude, longitude;
color hue;

void setup() {
  size(1000, 800, P3D);
  colorMode(HSB);
  background(0);
  lights();

  // Setup OSC communication
      osc = new OscP5(this, 12000);
      myRemoteLocation = new NetAddress("127.0.0.1", 13000);

  // 1. Data -------------------------------------------------------------
      ISSdata = loadJSONObject("http://api.open-notify.org/iss-now.json");
      ISSloc = ISSdata.getJSONObject("iss_position");
      latitude = ISSloc.getFloat("latitude");
      longitude = ISSloc.getFloat("longitude");

      String url = "http://api.openweathermap.org/data/2.5/weather?lat="+latitude+"&lon="+longitude+"&APPID=d15577960597a5b1339f2512346d70c1";
      WEATHERdata = loadJSONObject(url);
      weatherClouds = WEATHERdata.getJSONObject("clouds");
      weatherWind = WEATHERdata.getJSONObject("wind");
      cloudAmount = weatherClouds.getInt("all");
      windAmount = weatherWind.getFloat("speed");

      PEOPLEdata = loadJSONObject("http://api.open-notify.org/astros.json");
      people = PEOPLEdata.getJSONArray("people");
      peopleAmount = people.size();

      points = new PVector[peopleAmount];
  // ---------------------------------------------------------------------

  // 2. Mapping --------------------------------------------------------

    //2.1 Color
    if(month < 5 ){
       monthHue = map(month, 1, 5, 220, 80);
    }else if (month > 9){
       monthHue = map(month, 10, 12, 220, 280);
    } else if (month >= 5 && month <= 9){
       monthHue = map(month, 5, 9, 60, 0);
    }
    hue = color(monthHue,180,255);

    //2.2 Radius
    float radius = latitude*20;
  // ---------------------------------------------------------------------


  // 3. Algorithm --------------------------------------------------------
  noStroke();
  translate(width/2, height/2);

  for(int i = 0; i < peopleAmount; i++){
      float polarAngle = random(PI);
      float azimuthAngle = random(-PI, PI);
      float x = radius * sin(polarAngle) * cos(azimuthAngle);
      float y = radius * sin(polarAngle) * sin(azimuthAngle);
      float z = radius * cos(polarAngle);
      points[i] = new PVector(x , y, z);
      pushMatrix();
      translate(x,y,z);
      sphere(2);
      popMatrix();
  }

  // 4. Curves
  stroke(hue,40);
  strokeCap(ROUND);
  noFill();

  connections = new Connection[100];
  for(int i = 0; i < connections.length; i++){
    int s = int(random(points.length));
    int e = int(random(points.length));
    connections[i] = new Connection(center, points[s], points[e], 200);
  }
  // ---------------------------------------------------------------------
}

void draw() {
  background(0);
  strokeWeight(thickness);
  //thickness += 1;
  translate(width/2, height/2);


  // 4. Sensoric output -------------------------------------
   rotateY(rot);
   for(int i = 0; i < connections.length; i++){
      connections[i].drawBezier();
   }
   rot += 0.01;
}

void mousePressed(){
 OscMessage myMessage = new OscMessage("");
 myMessage.add(peopleAmount+" "+cloudAmount+" "+windAmount+" "+month+" "+latitude);
 osc.send(myMessage, myRemoteLocation);
 println(myMessage);
}

  // ---------------------------------------------------------------------
class Connection{
   PVector center, startPoint, endPoint, handleOne, handleTwo;
   float randomRange;


   Connection(PVector _center, PVector _startPoint, /*PVector _handleOne, PVector _handleTwo*/ PVector _endPoint, float _randomRange){
       center = _center;
       startPoint = _startPoint;
       endPoint = _endPoint;
       /*handleOne = _handleOne;
       handleTwo = _handleTwo;*/
       randomRange = _randomRange;
       handleOne = new PVector(center.x+random(-randomRange/2, randomRange/2), center.y+random(-randomRange/2, randomRange/2), center.z+random(-randomRange/2, randomRange/2));
       handleTwo = new PVector(center.x+random(-randomRange/2, randomRange/2), center.y+random(-randomRange/2, randomRange/2), center.z+random(-randomRange/2, randomRange/2));
    }

    void drawBezier(){
       bezier(startPoint.x, startPoint.y, startPoint.z, handleOne.x, handleOne.y, handleOne.z, handleTwo.x, handleTwo.y, handleTwo.z, endPoint.x, endPoint.y, endPoint.z);
    }

}
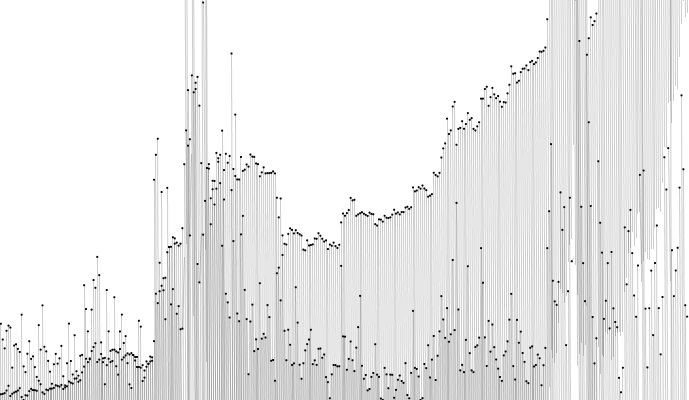
Example: Bitcoin data of the last 2 years
BCData datas;
BCData datas2;
float dt[];
float dt2[];

void setup(){
   size(690, 400);
   background(255);
   noStroke();
   fill(0);

   datas = new BCData();
   datas2 = new BCData();
   dt = new float[1000];
   dt2 = new float[1000];
   dt = datas.getBitcoinData("trade-volume", "1year");
   dt2 = datas.getBitcoinData("market-price", "1year");

   datas.printData(dt);
   datas.printData(dt2);
}

void draw(){

}
 // All Data from blockchain.info
// y-values are normalized to a scale from 0-100
// Keywords
// timespan: 30days, 60days, 180days, 1year, 2year, all
// data: market-price, trade-volume, difficulty, miners-revenue, trade-volume,
// coincirculation, market-cap, blocks-size, my-wallet-n-users, total-bitcoins


class BCData {
   JSONObject BCPrice;
   JSONArray BCPriceValues;
   float[] returnArray;

   BCData(){

   }

   float[] getBitcoinData(String dataset, String timespan){
     BCPrice = loadJSONObject("https://api.blockchain.info/charts/"+dataset+"?cors=true×pan="+timespan+"&format=json&lang=de");
     JSONArray BCPriceValues = BCPrice.getJSONArray("values");
     returnArray = processJSON(BCPriceValues);
     return returnArray;
   }

   void printData(float[] printdata){
     float scaling = 690.0/printdata.length;

     for (int i = 0; i < printdata.length; i++){
         float y = printdata[i];
         noStroke();
         ellipse(i*scaling, 400-(y*8), 2,2);
         if (i>0){
            float yOld = printdata[i-1];
            strokeWeight(1);
            stroke(0, 50);
            line((i-1)*scaling, 400-(yOld*8), i*scaling, 800-(y*8));
         }
     }
   }

   float[] processJSON(JSONArray JSONData){
     float [] processedData;
     processedData = new float[JSONData.size()];

     for (int i = 0; i < JSONData.size(); i++){
        JSONObject point = JSONData.getJSONObject(i);
        float y = point.getFloat("y");
        processedData[i] = y;
     }
     float minValue = min(processedData);                  // normalzie y-values to 0-100
     float maxValue = max(processedData);                  // so all data can be treated
     for(int i = 0; i < processedData.length; i++){        // equally later
        processedData[i] = map(processedData[i], minValue, maxValue, 0, 100);
     }
     return processedData;
   }
}
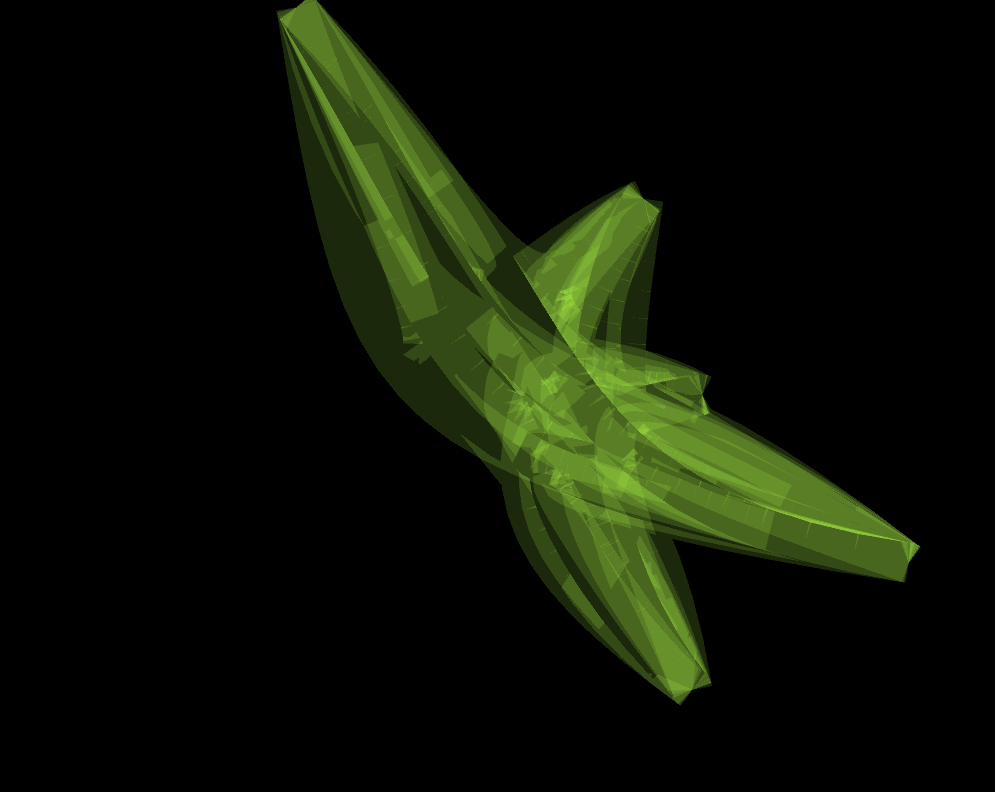
Example: Treating the bitcoin data differently


Link: Generative Logo from bitcoin data
Exercise: (45 Minutes)
Come up with your own mapping for bitcoin data (like price and amount) and generate 3D structures from it.
APIs
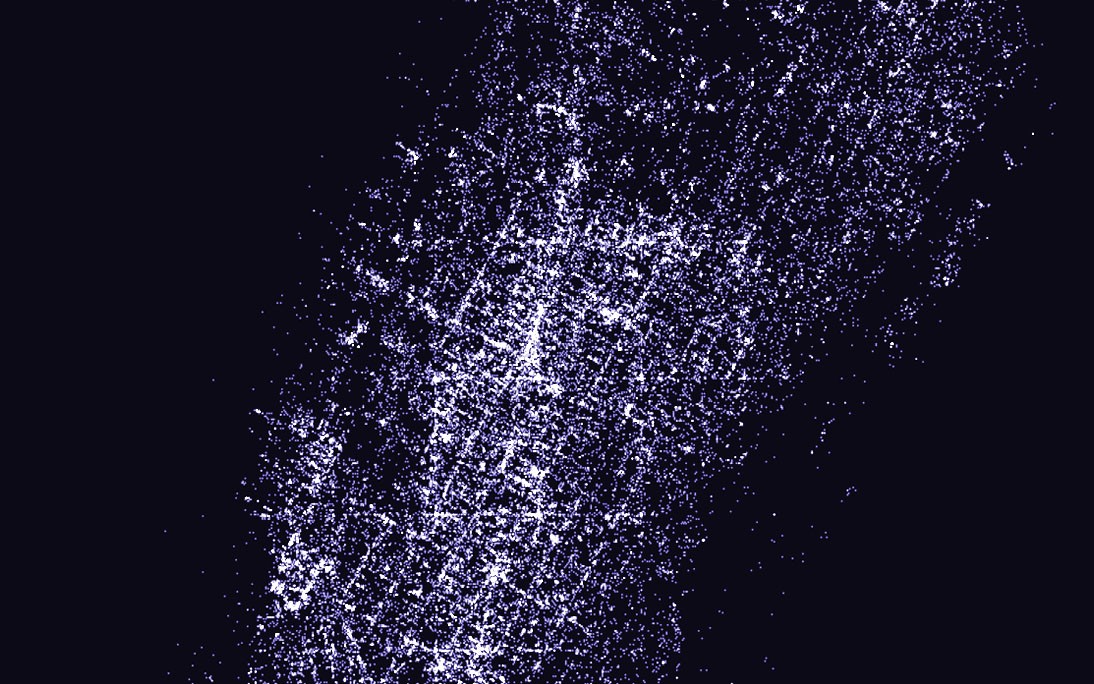
Beispiel: The Geotagger`s world atlas, Flickr: geodata, Mapbox: map
Explanation: citylab.

Example 1: A simple photo query using Flickr API
- Beischreibung der Argumente: Link.
- Request example: https://api.flickr.com/services/feeds/photos_public.gne?tags=linz&format=json&nojsoncallback=1
- Possible Arguments: Link
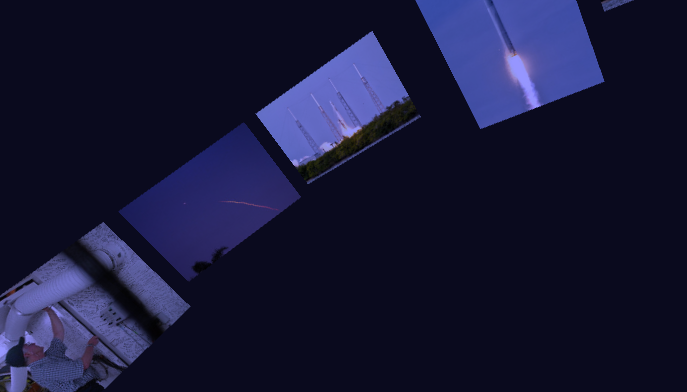
Code-Example: Loading Flickr Photos and display them in 3D space
import peasy.*;
PeasyCam cam;

JSONObject fJSON;
JSONArray fItems;
JSONObject singleItem;
JSONObject link;
ArrayList urls = new ArrayList();
ArrayList pics = new ArrayList();
float radius = 600;


void setup(){
  size(690, 400, P3D);
  cam = new PeasyCam(this, 0);
  fJSON = loadJSONObject("https://api.flickr.com/services/feeds/photos_public.gne?tags=nasa+launch&format=json&nojsoncallback=1");
  fItems = fJSON.getJSONArray("items");

  for (int i = 0; i < fItems.size(); i++){
    singleItem = fItems.getJSONObject(i);
    link = singleItem.getJSONObject("media");
    String s = link.getString("m");
    urls.add(new String(s));
    PImage p = loadImage(s);
    pics.add(p);
  }
}

void draw(){
  background(10,10,30);
  drawPics();
}

void drawPics(){
  float angle = 0;
  for (int i = 0; i < fItems.size(); i++){
     float stepSize = TWO_PI / fItems.size();      // set stepsize for rotation
     angle = i*stepSize;
     float px = 0 + (radius * cos(angle));
     float py = 0 ;
     float pz = 0 + (radius * sin(angle));
     PImage p = pics.get(i);

     pushMatrix();
     translate(px, py, pz);
     rotateY(-angle+PI/2);
     tint(150,150,255,255);
     image(p, 0, 0);
     popMatrix();
  }
}
More complex data requests in Flickr are possible, but therefore an authentification key (API-key) would be necessary. Usually you can get one by the provider of the data, sometimes easier, sometimes harder.
What are API-Keys?
"An application programming interface key (API key) is a code passed in by computer programs calling an application programming interface (API) to identify the calling program, its developer, or its user to the Web site. API keys are used to track and control how the API is being used, for example to prevent malicious use or abuse of the API (as defined perhaps by terms of service). The API key often acts as both a unique identifier and a secret token for authentication, and will generally have a set of access rights on the API associated with it." (wikipedia.org)
Example 2: Search the NY Times (using an API-Key)
- First we have to get an API-Key for authentification.
- Then we need to study the available parameters for our search: here
Code-Example: Conneting to the NY Times
JSONObject timesJSON;

String timesURL = "https://api.nytimes.com/svc/search/v2/articlesearch.json";
String apiKey = "5824ca6412e04214a75bedf771b25dd0";

void setup(){
  size(690, 400);
  background(255);
  timesJSON = loadJSONObject(timesURL + "?q=Algorithm?page=0&api-key=" + apiKey);

  println(timesJSON);

}

void draw(){


}
Exercise (30 Minutes):
Get your own API-Key for the NY Times API.
Take to code from above and search for a term (you can chose it yourself).
Visualize the amount of hits and publishing date (e.g. per year) for your term from the JSON response.
Remember the difference between JSONObject and JSONArray.